Tuesday, April 3, 2012

Links to NPR: Money in US Politics


Here's a link to an NPR episode on money in US politics.  You probably don't know how bad it really is:


Here's the teaser.  Just 10 minutes:


 Should make you want to listen to the main episode.

This American Life is doing a series, which we will try and keep you up on.

Wednesday, March 21, 2012

Links: Bank of America: Too Crooked to Fail

This should make you angry.  You're paying for it, and will pay perhaps thousands of dollars for it.
You.  Personally. And that may be if you're just lucky, since this sort of things screws up civilizations.

http://www.rollingstone.com/politics/news/bank-of-america-too-crooked-to-fail-20120314


Higher taxes. Higher prices.  Fewer services. Degraded quality of life.

The bank(s) is(are) half the problem.  The essential complicity of our government is the other half.

And more of the same with the so called JOBS bill  (Jump-start Our Business Startups) now going through Congress.   Investors will have another reason to beware, since it essentially reduces or does away with a lot of pesky disclosure formerly required of companies raising money from the public. Not that that will be a real problem, except to the suckers, er, investors, any company unwilling to disclose is looking for. 

Further, there is no reason to invest in an economy that is essentially frozen by excessive rent seeking, and as Matt Taibbi documents, is increasingly run as a Kleptocracy.

And this is the real reason for the decline in IPOs. (IPO is initial public offerings, the stock companies offer when they go public.) After all, disclosure wasn't a problem before  Certainly not in the 1990's, when there were hundreds each year, despite the disclosure laws they are now getting rid of.
 
As far as I can tell, the only difference between Democrats and Republicans is that the Democrats seem to use a little more grease. 

Monday, March 19, 2012

On the Need for Regulation of Oligopoly and Oligopsony


 A modern economy relies on a robust distribution of assets. This distribution of assets is necessary for its distribution of income.  It has a certain ‘shape,’ and the distributed income from these assets is necessary for it to maintain that shape.  Where ownership and control of these assets is narrow, the income from these assets goes to a small portion of the economy, depleting the rest of the economy of the income it needs to maintain itself  Even where there is redistribution, there is loss of efficiency.  While this is recognized with government redistribution, which is why large private interests often oppose it, it also happens with private redistribution, which tends to shortchange vital services which are not easy to extract profit from.   The privately powerful also have other interests in opposing or co-opting government authority, since government is, besides other private interests, the only counter-weight to their own unbridled power.  And this power will not always act in the public interest. Indeed, there is no reason, once it attains a certain magnitude, to imagine that it would act in the public interest, and instead that it would see the public as a source of rent extraction and exploitation.   

Our point is that while regulation may be a matter of justice, it is as importantly a matter of economic stability and efficiency.

There is clearly a need for regulation in monopoly. It is in the interests of the monopolist to produce less and charge more for what is produced, reaping an extra normal profit.  Extra normal profit translates into extra normal growth.  This results in an increase in the share of the economy going to the monopolist.  When the monopoly is small, this is incidental to the economy.  Where large, in proportion to the economy, however, it is insupportable in the long term.   

Just as in monopoly and monopsony, we see a need for regulation in oligopoly and oligopsony, and their combination oligonomy.  (When referring to all or any of them, we’ll use term oligopy, and similarly oligopist.)   The point is that rational behavior for the oligopist is not the best outcome for society. The oligopolist will produce less, and charge higher prices, than at competitive equilibrium.  The oligopsonist will pay less, and buy less, than at competitive equilibrium. Both will reap extra normal profits. The continuing transfer of wealth to the oligopist leads to accumulation and concentration of wealth and power, and a depletion of the wealth from the rest of society, while at the same time shorting the economy of goods and services it otherwise desires and even needs.

But this is not even in the long range interest of the oligopist.  For the oligopist, his market must grow at a rate equal to his own.  But by collecting extra normal profits from his market, his market cannot grow at that rate. His market grows, if at all, at a slower rate, and this rate limits the rate at which the oligopist himself can grow.

An oligopsony reduces the revenue available to producers facing that oligopsony.  Producers cannot sell as much, nor can they get the best prices for what they do sell.  They are thus discouraged from production.  Fewer enter the market.  Production is less reinvested in, becomes undercapitalized, and tends towards obsolete methods. 

When the oligopsony is in labor markets, (and the destruction of labor union power has essentially resulted in such an oligopsony,) it has these effects on the investment in human capital.  There is greater unemployment, greater underemployment, and less investment in education, as the labor force becomes undercapitalized, and tends towards obsolescence.

An oligopoly, where it is a supplier of factors for other producers, (and even finished goods may be regarded as factors for labor,) has the same effect. Because the producer forced to buy his factors from an oligopolist must pay more for those factors than he would if he could buy his goods in a more competitive market.  His product must either be more expensive, sell for more and at reduced quantity, or, if priced the same, sell at reduced profit.  His revenue is reduced.  His ability to capitalize his business is reduced.  Production is less reinvested in, becomes undercapitalized, and tends towards obsolete methods.   

The oligopist, because of his power, finds himself in a situation where he must sacrifice the long range good of society, and thus his own long term interests, for the short run interests of his oligopy.   Putting it the other way, if he were to seek to better serve his society, he must put his firm at disadvantage. The only other option is to cooperate with his fellow oligopists in producing, or buying. to competitive equilibrium,  in price and quantity. But this would entail sacrificing their extra normal profits, and worse, losing market share in the event any of the other oligopists defected, and ceased to cooperate.  (Of course, they could always cooperate to enhance their extra normal profits, to society’s detriment.) The preservation of his society is simply not seen in his best interests. This is a situation he would not be in with more perfect competition, when his interests would be more closely aligned with that of the economy at large.  

And it is a situation of composition.  Where oligopy is a relatively small portion of the economy, the economy can endure the distortions brought about by the abnormal profits of the oligopy.  The rent collected is not so exorbitant that it cannot be compensated for, at least to some degree, by the other operations of the economy.

 It is worse when oligopy is pervasive. Suppose the economy consists, somewhat evenly divided, of oligopy and its market. Then the oligopist is in a quandary.   What can he do with his extra normal profits?  It is pointless to invest in the oligopy’s market, which, limited in profit from facing the oligopy, is restricted in growth.   And it is pointless to invest further in the oligopy, which, because its market is restricted in growth, itself is restricted in growth.   Since there is no profitable investment in the real economy, he seeks to invest in the financial economy.  But the financial economy is also limited by the real economy.  Financial assets must eventually be redeemed for real assets, but since the growth in real assets is arrested by the extra normal profits of oligopy, there is no growth in the real assets for any growth in the financial assets to be redeemed for.  The result is a surplus of money for investment, with no real profitable opportunity.

This is the important point.  Unregulated oligopy, with its extra normal profits, when it becomes extensive, arrests the growth of the entire economy.  Indeed, the situation is actually worse, because by continuing to purge the rest of the economy of its normal income, it can cause the rest of the economy’s revenue to be less than its expenses.  Thus, the remainder of the economy, the oligopist’s market, may actually be forced into contraction.  But this is bad for the oligopist as well. For an oligopolist, it will shift the demand curve left and/or down, thus reducing the optimum quantity, or the price, or both, depending.  In any case, the revenue will be reduced.

With a straight demand curve, shifting it left, down, or left and down, are all equivalent.  With a kinked, or curved, demand curve, these each result in different diagrams, so we have to figure what factors will reduce the price, but not the quantity demanded, and which will reduce the quantity demanded, but not the price, and which both.  We must follow the kink, since that is where the price and quantity will become fixed at. 

If money were taken out of the market for food, say, a good with a relatively inelastic demand, the quantity demanded would probably not change, but the price would decline. The demand curve would shift downward, and pa would decline.   In the food market it would be price deflationary.  In the more elastic market for luxury goods, the quantity demanded would probably change, but maybe not so much the price. qa would shift to the left, but pa would not change so much.  For goods or services in intermediate elasticity, the demand curve would probably shift down and to the left, and both pa and qa would change.   

(And similarly for increases in the demand curve.  The demand curve would shift up for inelastic, right for elastic, or both, depending on the price elasticity of the good or service demanded.)

In analyzing the situation, reducing the economy to just an oligopy and the rest of the economy, the situation then reduces to the producer-consumer problem, with the oligopist in the position of the producer. But of course, the oligopist attains his advantage, and his extra normal profits, not by doing more, but by doing less, and charging more, and paying less.  Rather than contributing his ‘fair share’ for the economy, of ‘pulling his weight,’ he slacks off, and uses oligopistic power to demand more money for what he does contribute, and to pay less for what others contribute.  That is, compared to the rest of the economy, he becomes a net consumer, the consumer of the purchases of his extra normal profits.   So really, it is more accurately described as the strong sector vs. weak sector economy, with the strong sector extracting its rents from the weak sector. See:  http://anamecon.blogspot.com/2011/11/morality-and-debt.html

We see here, with oligopy, Adam Smith's invisible hand, rather than acting to the benefit of society, acts to its detriment.

So now that we have established the need, the issue becomes what techniques can most efficiently counter the redistributionist tendencies of oligopy.

Thursday, March 1, 2012

Link to Michael Hudson on How Banks Plan


Another gem from Michael Hudson:


“…Everything over subsistence, they’ll want as a loan…”
“…Once the entire surplus is paid to the banks, there’s nothing  (left) over for rising living standards, there’s nothing over for new capital investment, there’s nothing over for long term research and development…”

Further, once growth is arrested, so is growth of the bank's investments.  It becomes a fixed income stream on a fixed asset.  Optimum is for the banks to aim for optimum real growth rate.  But banks can’t do this.

Saturday, February 18, 2012

Oligopsonies in an Economy


Our study of oligopsonies will follow our study of oligopolies, which the reader will find helpful to refer to.  Oligopsonies are another example of the macroeconomic effects of microeconomic processes.  The derivation is based on the idea of the kinked supply curve, which may be out there but doesn’t seem easy to find. That oligopsonies create market distortion is well known. 

We discuss competitive oligopsonies, where collusion is not necessary.

For your convenience a little background. Oligopsonies are ubiquitous. It seems many markets evolve into them.  Although consumers do not directly experience them, (except in labor markets,) they may often occur as the back end of oligopolies. One oligopsony is the fast food industry, which forms an oligopsony to meat sellers.   It also forms an oligopoly to cheeseburger buyers.  (A suggested word is oligonomy. See: http://activism101.ning.com/profiles/blogs/oligonomy-defined) The factors, goods or services which go into the oligopolist’s product, which are unique to an oligopoly, face oligopsony. 

Other examples of (non-labor) oligopsony are 1:  Cocoa market, where three firms buy the vast majority of cocoa.  2:  American tobacco market, where three cigarette makers buy 90% of all tobacco grown in the US. 3: the culinary herb market.  
 The various drug cartels  may also constitute a oligopsony for drug producers, and an oligopoly for drug users.

The characteristics of an oligopsony are 1:  It consists of a relatively few, relatively large, buyers.  2:  Each firm is big enough to affect the others. That is, the prices each firm pays affect the prices paid by the other firms. 3:  The goods or services they buy are similar or identical.  4:  There are barriers to entry, such as initial capital costs. A firm needs to be capitalized to have a profitable use for what it buys.  

Those not interested in the derivation may jump ahead to the discussion at the conclusion.  Those interested might also find discussions on monopsony helpful.  Here’s one:

Since oligopsonies are buyers instead of sellers, instead of a kinked demand curve, the individual oligopsonist faces a kinked supply curve, S, which is also his average cost curve AC, This is the price he pays for his goods,.  Diagram 1 shows this supply curve for a particular oligopsonist.  The oligopsonist wants to buy at the kink, a which is at some price pa, which is really determined by the market, and some quantity qa, which is determined by other factors, which we will discuss in the conclusion. In any event, the kink at which he buys is at a lower price than the price at competitive equilibrium, (around e) and a smaller quantity.  His total cost is price times quantity bought, or pa x qa.

Why does he want to buy at price pa?  If he lowers the prices he offers below pa, to pb, hoping to save money, none of his competitors will follow.  Since his prices are below theirs, and because they are all buying the same of similar goods, sellers will go to his competition, and he will lose market share. (Note the assumption that there is not so much to sell, that many buyers will have to come to him, anyway.) If the price he offers goes down a little, the quantity of goods he is able to buy will go way down, to qb.  This is the characteristic of an elastic supply curve.  As you move down the curve, the quantity the oligopsoninst is able to buy goes down.  Since these goods are factors of production, the oligopsonist can no longer produce at the same scale as before, cutting into his profit margins. 

Suppose instead he raises the prices he offers, from pa to pc, hoping to gain market share.  Then his competitors will quickly follow suit, since they don’t want to lose their market share to him.  So he won’t gain market share, he’ll just be buying at a higher price.  He may, however, buy a few more, at qc, just because his and everybody’s price is higher.   This is characteristic of an inelastic supply curve.  Since his costs per unit are higher, his profit margins are likely to be slimmer, since he won’t be producing appreciably more of his product.  

Now for a firm to maximize profits, its marginal costs, MC, must equal its marginal revenue product, MRP, which is also its demand curve, D.   This is always the case, but what does this mean?    The marginal revenue product, MRP, is the use the oligopsonist gets out of the next unit he buys.  This is (mostly) a decreasing function because of the law of diminishing returns.  This decreasing function is what we show in the diagram. (But we say mostly because consider our restauranteur buying labor. In his case the first worker is useless. He is simply not enough to run a restaurant.   So his MRP for labor starts at zero and  increases until it reaches some maximum, then decreases steadily, since further workers start getting in each other’s way and contribute an ever decreasing amount to his total profit.  Most analyses ignore this, and you can, too.  For goods, the MRP is  usually a simpler, a steadily decreasing function, although again economies of scale would make it first go up.)

Marginal cost is the increase in cost that results from buying one more unit.    For imperfect competition, as we have in the case of oligopsonies, MC is always more than the average cost, AC.  (AC is also the supply curve, S, remember.)  This is because when you buy more units, you have to buy them at a higher price, but you have to buy all your units at that higher price.   So if the firm buys 4 units for $60 and has to pay $90 for 5 units, then the marginal cost of the fifth unit is $30.   The average cost however, is $18, and lower than the marginal cost.


Profit is maximized when MRP = MC because when MC is greater than MRP, it costs more to buy the next unit than you get use out of it.  With the figures we used, you would buy 4 units for $60, get use out of them for $100, (manufacture some things you can sell for $100, say,) and make $40 profit.  If you were maximizing profit, you wouldn’t then buy 5 units for $90, having use of them for $125, and only make $35 profit. 

See Diagram 2.  The marginal revenue product MRP curve is the downward sloping line.

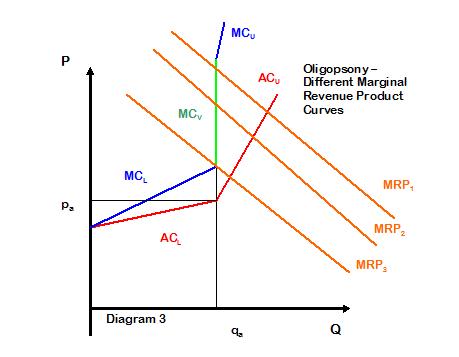
With the kinked supply or AC curve, the MC curve is very strange.  The ACL and the MCL curve, the curves below the kink, both start at the same point on the axis, (in the direction where the arrows come together,) but the MCL curve ascends more steeply, twice as steep, it turns out. When they reach the kink, however, the MCU and ACU curves, the curves above the kink, also extend from a point on the axis, (much lower on the axis) in the direction of the dotted arrows, so the MCU curve, being twice as steep as the ACU curve, is much higher than the MCL curve at the kink. (The upper and lower labels are for convenience.  They are just different parts of the same line.)

What is important is the green line, the marginal cost MCV curve at the kink, which is vertical.  Now since, when we maximize profit, MRP = MC, when ever MRP crosses the green MCV line, (at the star,) the profit maximizing quantity qa and price pa are going to stay the same.  See Diagram 3.  The firm, whether its marginal revenue product curve is MRP1, or MRP2 or MRP3  is going to want to buy the same amount qa, and pay the same price pa.  This will maximize its profit.

Conclusion:  Since firms in oligopsonistic competition tend to be locked in to price, they must find other ways to compete, and maintain or gain market share.  The leader of a drug cartel, for instance, might resort to escalating levels of violence to secure market share.   (We make the casual observation that one need look no further than oligopsony, (and oligopoly,) pricing to deduce a cause for Keynesian ‘price stickiness.’  In an economy rife with oligopsony we would expect many points of price, and quantity, fixedness, making deflation a uneven and problematic process.) 

Consider MRP3 in Diagram 3.  The oligopsonist would not want to lower marginal revenue product any more, through non-price competition, because then his profit maximization would occur at a price lower than pa, and he would lose market share.

However, the opposite can also happen.  Since price is, with in a range, independent of costs, the oligopsonist may decide to increase  his MRP, use what he buys more efficiently, and so increase his profit that way. 

Oligopsonies do not consist of identical or identically sized firms, with identical shares of the market. The quantity a particular oligopsonist buys at is determined by historical factors, and his ability, or inclination, to compete in ways which do not affect the price he offers for the goods or services he buys. Working conditions, for instance, may be one way a labor oligopsonist may attract a better class of laborer, enhance his MRP, and so his profits. Historical factors, for instance, most notably their activities during the period their industry was more competitive and open, determined the relative sizes of Wendy’s, McDonald’s and Burger King before they filled the market and became an oligopsony.  Decisions since have changed their relative sizes and profitability.   

Another point is that, unlike perfect competition, firms of various efficiencies can co-exist in an oligopsony, operating at differing capacities and different economies of scale, each firm collecting its particular degree of profit.  And unlike perfect competition,  much of this profit is extra-normal.  Even an inefficient firm can make an extra-normal profit.

What other things might we expect?  Well, we would expect the transfer of some producer surplus to the buyer, in the form of his extra-normal profits. (The oligopsonistic buyer is seldom the ultimate consumer.) Consider that oligopsonies are becoming economically pervasive.  Each of these oligopsonies extracts its rent, transferring resources from producers, to the oligopsonists.  Indeed, to simplify considerations, let us just model the entire economy as two tiers, consisting of an oligopsony and those who sell to it.  Consider first perfect competition, where the economy was efficient and in balance, Diagram 4. 

 Supply equals demand and the equilibrium point e, and surplus is divided between seller and buyer. With oligopsony, Diagram 5, there is a net transfer of surplus from the seller to the oligopsonists. (the greenish-yellow box)  In the real economy, this would be manifest as lower producer profits.  We would thus expect a gradual decapitalization of  producers.  In a labor oligopsony, we would expect decrease in the welfare of labor, as the increase in the income of the oligopsonist has to come from somewhere. 
 
Efficiency has also declined because an oligopsony buys less than the competitive equilibrium production, at a lower price creating what is called deadweight loss:  The blue triangle in Diagram 5.  (I’m not sure if the blue triangle is exactly the right one, as I am not sure the exact location of the point of competitive equilibrium in the absence of oligopsony.) That is, the economy is producing less than it would otherwise, perhaps less than it needs to.  In a labor market, this would imply increased levels of unemployment.  For instance, since the public sector also supplies the private sector, as the private sector becomes increasingly organized as oligopsony, we would expect public sector income, supported by taxes on labor costs, to decrease.  We would also expect, due to dead weight loss, an increasing shortage of public goods.


Wednesday, February 1, 2012

Oligopoly and the Economy


This is a brief discussion of the effect of oligopolies on an economy. It is an example of the macroeconomic effects of microeconomic processes.   The derivation is based on the idea of the kinked demand curve, developed by Paul Sweezy in the 1950’s. 
Those not interested in the derivation may jump ahead to the discussion at the conclusion. 
Those interested may find the various derivations of kinked demand curve theory on You Tube helpful, and perhaps easier to follow than what I have presented here.  Here’s one:
http://www.youtube.com/watch?v=5BQPx8SL9F4.
You might also find  discussions on monopoly, a simpler case of extra-normal profit, helpful.  Here’s one:
http://www.youtube.com/watch?v=3NMbcfS68IQ&feature=related
And for contrast, perfect competition:

We discuss competitive oligopolies, where collusion is not necessary for fixed prices.
For your convenience a little background.  Oligopolies are a common market structure.  Indeed, many markets seem to evolve, or  have evolved, into oligopolies, (or its cousin, oligopsonies,)  They are ubiquitous.

An oligopoly has some of the characteristics of a monopoly, in that its members can charge higher than normal prices and make higher than normal profits.  The particular characteristics of an oligopoly are,  1 It consists of a relatively few, relatively large, sellers  2.  Each firm is big enough to affect the others. 3:  The products are similar or identical.  4:  There are barriers to entry, such as initial capital costs. 

The traditional analysis of oligopolies is that, rather than a normal straight demand curve, they face a kinked demand curve D, which for a particular firm is also their average revenue curve AR.  Diagram 1 shows this demand curve for a particular oligopolist.  The oligopolist wants to sell at the kink, which is at some price pa, which is really determined by the market, and some quantity qa, which is determined by other factors, which we will discuss in the conclusion.In any event, the kink is at a price higher than the equilibrium price in perfect competition, and a quantity lower than the equilibrium quantity. Fewer goods are produced, and consumers are forced to pay a higher price for them.

If we were to discuss all the members of this oligopoly, they would each have a separate, though similar, diagram.  The prices at the kink would all be the same, but the quantities at the kink might be different. 

  
Our oligopolist’s total revenue, that is, how much money he takes in, is price times quantity sold, or pa x qa.

Why does he want to sell at price pa?  If he raises his prices above pa, to pb hoping to make an extra profit, none of his competitors will follow.  So his prices will be above theirs, and because their products are similar to or identical to his, he will lose some, perhaps many of his customers to them.  If his price goes up a little, the quantity of products he sells will go way down, to qb so he will take in less money. The area  
pb x qb, the money he takes in now, is less than the area pa x qa, the money he took in before.  This is the characteristic of an elastic demand curve. As you move up the curve, the quantity sold goes down faster than the price goes up.   

Suppose instead he lowers his prices, below pa, to pc,  hoping to gain market share.  Then his competitors will quickly follow suit, since they don’t want to lose their market share to him.  So he won’t gain market share, he’ll just be selling at a lower price, and making less money.  He may sell a few more products, at qc just because his, and everybody’s, price is lower, but not enough to compensate for the decrease in price.    The area  pc x qc , the money he takes in now, is less than the area pa x qa, the money he took in before.  This is the characteristic of an inelastic demand curve.  As you go down the demand curve, the price goes down faster than the quantity sold goes up.

Now for a firm to maximize profits, its marginal costs, MC, must equal its marginal revenue MR.  This is always the case, but what does this mean?  Marginal cost is the increase in total cost accrued by the firm for the next unit it produces.  If the firm produces 4 units for $60 and 5 units for $90, then the marginal cost of the fifth unit is $30.

Marginal revenue is the increase in revenue that results from selling one more unit.    For imperfect competition, as we have in the case of oligopolies, MR is always less than the average revenue, AR.  This is because when you sell more units, you have to sell them at a lower price, but you have to sell all your units at that lower price.  So if you sell 4 units at $100 total revenue and 5 units at $120 total revenue the average revenue AR, the price you are selling them at, for 5 units is $24, but the marginal revenue MR for the 5th unit is only $20.

Profit is maximized when MR = MC because when MC is greater than MR, it costs more to produce the next unit than you get paid for it.  With the figures we used, you would produce 4 units for $60, sell them for $100, and make $40 profit.  If you were maximizing profit, you wouldn’t make 5 units for $90, having to sell them at $120, and only make $30 profit. 

See Diagram 2.  The marginal cost MC curve is the lopsided “u.” When you produce something, costs first go down, savings of scale, then they go up, dissavings of scale.  (Imagine a restaurant.  The first meal is very costly, because of all your fixed costs. As you produce more, each next meal is cheaper to produce, as you use your assets more efficiently, until you reach some minimum.  Then the costs per each additional meal start going back up, because you run out of stove space, people start getting in each others way, etc.) 

With the kinked demand or AR curve, the MR curve is very strange.  The upper ARU and the upper MRU curve, the curves above the kink,  both start at the same point on the axis, (in the direction where the arrows come together,) but the MRU curve descends more steeply, twice as steep, it turns out. When they reach the kink, however, the MRL and ARL curves, the curves below the kink, also extend from a point on the axis, (much higher on the axis) in the direction of the dotted arrows, so the MRL curve, being twice as steep as the ARL curve, is much lower than the MRU curve at the kink.  In this diagram, in fact, it is so much lower it is negative, which means MRL curve is irrelevant.  What is not irrelevant is the fact that, because MRL is negative, the MR curve which connects the MRU and MRL curves,  (green line) crosses the Q axis at the kink.  This means that the quantity of production of maximum revenue (which is where the MR curve crosses the Q axis) and profit maximization (where MR = MC)are at the same quantity, qa.

What is important is the green line, the MR curve at the kink.  Now since, when we maximize profit,  MR = MC, when ever MC crosses the green line, the profit maximizing quantity and price are going to stay the same.  See Diagram 3.  The firm, whether its marginal cost curve is MC1, or MC2 or MCis going to want to produce the same amount, and charge the same price.  Here this will maximize both profit and revenue.


Conclusion:
 Even in competition, oligopolists can make extra-normal profits.   Firms in oligopolistic competition tend to be locked in to price, so they must find other ways to compete, and maintain or gain market share.  (We make the casual observation that one need look no further than oligopoly pricing (and as we shall see, oligopsony pricing) to deduce a cause for Keynesian ‘price stickiness.’  In an economy rife with oligopoly we would expect many points of price, and quantity, fixedness, making deflation a uneven and problematic process.)  The owner of a service station, for instance, locked in competition with 3 other service stations at an intersection, might, to attract more customers, initiate full service, or add a convenience store or coffee shop.  He might do this, raising his costs, until the marginal cost curve was something like MC3 in Diagram 3.  The oligopolist would not want to raise costs any more, because then his profit maximization would occur at a price higher than pa, and he would lose market share.

However, the opposite can also happen.  Since price is, with in a range, independent of costs, the oligopolist may decide to shave costs, cut corners, and so increase his profit that way.  Were an industry to do this, we would have a situation like the American auto industry in the 60’s and 70’s, before imports began to significantly impact on their market.

Oligopolies do not consist of identical or identically sized firms, with identical shares of the market. The quantity a particular oligopolist sells at is determined by historical factors, and his ability, or inclination, to compete in ways which do not affect the price.  Historical factors, for instance, most notably their activities during the period their industry was more competitive and open, determined the relative sizes of GM, Ford, Chrysler, and American Motors, back when they constituted an oligopoly.  Foreign Competition and decisions since have changed their relative sizes and profitability.   

Another point is that, unlike perfect competition, firms of various efficiencies can co-exist in an oligopoly, operating at differing capacities and different economies of scale, each firm collecting its particular degree of profit.  And unlike perfect competition, much of this profit is extra-normal, more than the profits we would expect to see from perfect competition, which tends to drive profit to a minimum.

What other things might we expect?  Well, we would expect the transfer of some consumer surplus to the producer, in the form of his extra-normal profits.  Consider that oligopolies are becoming economically pervasive.  Each of these oligopolies extracts its rent, transferring resources from consumers, to the oligopolists.  Indeed, to simplify considerations, let us just model the entire economy as two tiers, consisting of an oligopoly and its market.  Consider first perfect competition, where the economy was efficient and in balance, Diagram 4.


Supply equals demand and the equilibrium point is at e, and surplus is divided between consumer and producer. (Consumer’s Surplus is  exaggerated a bit, to keep the lines the same.  Sorry.)  With oligopoly, Diagram 5, there is a net transfer of surplus from the consumer to the oligopolists. (the greenish-yellow box) 


 In the real economy, this would be manifest as higher corporate profits, and, since most corporate stock is held by the wealthy, an increase in income of the wealthy.  Corresponding to this, we would expect a decrease in the welfare of the rest of the economy, as the increase in income of the wealthy has to come from somewhere.

Efficiency has also declined because an oligopoly produces less than the competitive equilibrium production, at a higher price creating deadweight loss:  The blue triangle.  That is, the economy is producing less than it would otherwise, less than consumers would be willing to buy at the lower, equilibrium, price.  Indeed, the economy may perhaps be producing less than it needs to.  For instance, since the public sector is also supplied by the private sector, as the private sector becomes increasingly organized as oligopoly, we would expect public sector costs to increase disproportionately.  We would also expect, due to dead weight loss, an increasing shortage, and/or a decline of the quality, of public goods.  This includes much of the infrastructure the private sector, the oligopolist, relies on.

Wednesday, January 11, 2012

Link to Michael Hudson- Democracy and Debt

Nice read here:

http://michael-hudson.com/2011/12/democracy-and-debt/

All about the financial sector’s inability to restrain their economically destructive tendencies throughout history, and the social ruin attendant on their ascendancy.
We get to see it again. They get to see it again. And they still can’t restrain themselves.