Saturday, February 18, 2012

Oligopsonies in an Economy


Our study of oligopsonies will follow our study of oligopolies, which the reader will find helpful to refer to.  Oligopsonies are another example of the macroeconomic effects of microeconomic processes.  The derivation is based on the idea of the kinked supply curve, which may be out there but doesn’t seem easy to find. That oligopsonies create market distortion is well known. 

We discuss competitive oligopsonies, where collusion is not necessary.

For your convenience a little background. Oligopsonies are ubiquitous. It seems many markets evolve into them.  Although consumers do not directly experience them, (except in labor markets,) they may often occur as the back end of oligopolies. One oligopsony is the fast food industry, which forms an oligopsony to meat sellers.   It also forms an oligopoly to cheeseburger buyers.  (A suggested word is oligonomy. See: http://activism101.ning.com/profiles/blogs/oligonomy-defined) The factors, goods or services which go into the oligopolist’s product, which are unique to an oligopoly, face oligopsony. 

Other examples of (non-labor) oligopsony are 1:  Cocoa market, where three firms buy the vast majority of cocoa.  2:  American tobacco market, where three cigarette makers buy 90% of all tobacco grown in the US. 3: the culinary herb market.  
 The various drug cartels  may also constitute a oligopsony for drug producers, and an oligopoly for drug users.

The characteristics of an oligopsony are 1:  It consists of a relatively few, relatively large, buyers.  2:  Each firm is big enough to affect the others. That is, the prices each firm pays affect the prices paid by the other firms. 3:  The goods or services they buy are similar or identical.  4:  There are barriers to entry, such as initial capital costs. A firm needs to be capitalized to have a profitable use for what it buys.  

Those not interested in the derivation may jump ahead to the discussion at the conclusion.  Those interested might also find discussions on monopsony helpful.  Here’s one:

Since oligopsonies are buyers instead of sellers, instead of a kinked demand curve, the individual oligopsonist faces a kinked supply curve, S, which is also his average cost curve AC, This is the price he pays for his goods,.  Diagram 1 shows this supply curve for a particular oligopsonist.  The oligopsonist wants to buy at the kink, a which is at some price pa, which is really determined by the market, and some quantity qa, which is determined by other factors, which we will discuss in the conclusion. In any event, the kink at which he buys is at a lower price than the price at competitive equilibrium, (around e) and a smaller quantity.  His total cost is price times quantity bought, or pa x qa.

Why does he want to buy at price pa?  If he lowers the prices he offers below pa, to pb, hoping to save money, none of his competitors will follow.  Since his prices are below theirs, and because they are all buying the same of similar goods, sellers will go to his competition, and he will lose market share. (Note the assumption that there is not so much to sell, that many buyers will have to come to him, anyway.) If the price he offers goes down a little, the quantity of goods he is able to buy will go way down, to qb.  This is the characteristic of an elastic supply curve.  As you move down the curve, the quantity the oligopsoninst is able to buy goes down.  Since these goods are factors of production, the oligopsonist can no longer produce at the same scale as before, cutting into his profit margins. 

Suppose instead he raises the prices he offers, from pa to pc, hoping to gain market share.  Then his competitors will quickly follow suit, since they don’t want to lose their market share to him.  So he won’t gain market share, he’ll just be buying at a higher price.  He may, however, buy a few more, at qc, just because his and everybody’s price is higher.   This is characteristic of an inelastic supply curve.  Since his costs per unit are higher, his profit margins are likely to be slimmer, since he won’t be producing appreciably more of his product.  

Now for a firm to maximize profits, its marginal costs, MC, must equal its marginal revenue product, MRP, which is also its demand curve, D.   This is always the case, but what does this mean?    The marginal revenue product, MRP, is the use the oligopsonist gets out of the next unit he buys.  This is (mostly) a decreasing function because of the law of diminishing returns.  This decreasing function is what we show in the diagram. (But we say mostly because consider our restauranteur buying labor. In his case the first worker is useless. He is simply not enough to run a restaurant.   So his MRP for labor starts at zero and  increases until it reaches some maximum, then decreases steadily, since further workers start getting in each other’s way and contribute an ever decreasing amount to his total profit.  Most analyses ignore this, and you can, too.  For goods, the MRP is  usually a simpler, a steadily decreasing function, although again economies of scale would make it first go up.)

Marginal cost is the increase in cost that results from buying one more unit.    For imperfect competition, as we have in the case of oligopsonies, MC is always more than the average cost, AC.  (AC is also the supply curve, S, remember.)  This is because when you buy more units, you have to buy them at a higher price, but you have to buy all your units at that higher price.   So if the firm buys 4 units for $60 and has to pay $90 for 5 units, then the marginal cost of the fifth unit is $30.   The average cost however, is $18, and lower than the marginal cost.


Profit is maximized when MRP = MC because when MC is greater than MRP, it costs more to buy the next unit than you get use out of it.  With the figures we used, you would buy 4 units for $60, get use out of them for $100, (manufacture some things you can sell for $100, say,) and make $40 profit.  If you were maximizing profit, you wouldn’t then buy 5 units for $90, having use of them for $125, and only make $35 profit. 

See Diagram 2.  The marginal revenue product MRP curve is the downward sloping line.

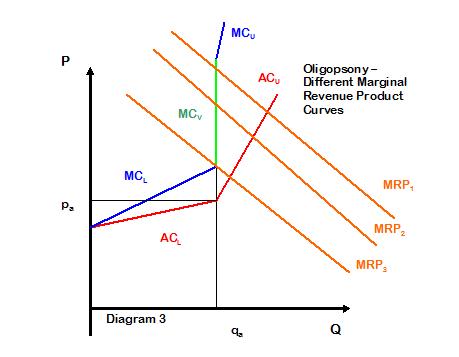
With the kinked supply or AC curve, the MC curve is very strange.  The ACL and the MCL curve, the curves below the kink, both start at the same point on the axis, (in the direction where the arrows come together,) but the MCL curve ascends more steeply, twice as steep, it turns out. When they reach the kink, however, the MCU and ACU curves, the curves above the kink, also extend from a point on the axis, (much lower on the axis) in the direction of the dotted arrows, so the MCU curve, being twice as steep as the ACU curve, is much higher than the MCL curve at the kink. (The upper and lower labels are for convenience.  They are just different parts of the same line.)

What is important is the green line, the marginal cost MCV curve at the kink, which is vertical.  Now since, when we maximize profit, MRP = MC, when ever MRP crosses the green MCV line, (at the star,) the profit maximizing quantity qa and price pa are going to stay the same.  See Diagram 3.  The firm, whether its marginal revenue product curve is MRP1, or MRP2 or MRP3  is going to want to buy the same amount qa, and pay the same price pa.  This will maximize its profit.
Conclusion:  Since firms in oligopsonistic competition tend to be locked in to price, they must find other ways to compete, and maintain or gain market share.  The leader of a drug cartel, for instance, might resort to escalating levels of violence to secure market share.   (We make the casual observation that one need look no further than oligopsony, (and oligopoly,) pricing to deduce a cause for Keynesian ‘price stickiness.’  In an economy rife with oligopsony we would expect many points of price, and quantity, fixedness, making deflation a uneven and problematic process.) 

Consider MRP3 in Diagram 3.  The oligopsonist would not want to lower marginal revenue product any more, through non-price competition, because then his profit maximization would occur at a price lower than pa, and he would lose market share.

However, the opposite can also happen.  Since price is, with in a range, independent of costs, the oligopsonist may decide to increase  his MRP, use what he buys more efficiently, and so increase his profit that way. 

Oligopsonies do not consist of identical or identically sized firms, with identical shares of the market. The quantity a particular oligopsonist buys at is determined by historical factors, and his ability, or inclination, to compete in ways which do not affect the price he offers for the goods or services he buys. Working conditions, for instance, may be one way a labor oligopsonist may attract a better class of laborer, enhance his MRP, and so his profits. Historical factors, for instance, most notably their activities during the period their industry was more competitive and open, determined the relative sizes of Wendy’s, McDonald’s and Burger King before they filled the market and became an oligopsony.  Decisions since have changed their relative sizes and profitability.   

Another point is that, unlike perfect competition, firms of various efficiencies can co-exist in an oligopsony, operating at differing capacities and different economies of scale, each firm collecting its particular degree of profit.  And unlike perfect competition,  much of this profit is extra-normal.  Even an inefficient firm can make an extra-normal profit.

What other things might we expect?  Well, we would expect the transfer of some producer surplus to the buyer, in the form of his extra-normal profits. (The oligopsonistic buyer is seldom the ultimate consumer.) Consider that oligopsonies are becoming economically pervasive.  Each of these oligopsonies extracts its rent, transferring resources from producers, to the oligopsonists.  Indeed, to simplify considerations, let us just model the entire economy as two tiers, consisting of an oligopsony and those who sell to it.  Consider first perfect competition, where the economy was efficient and in balance, Diagram 4. 

 Supply equals demand and the equilibrium point e, and surplus is divided between seller and buyer. With oligopsony, Diagram 5, there is a net transfer of surplus from the seller to the oligopsonists. (the greenish-yellow box)  In the real economy, this would be manifest as lower producer profits.  We would thus expect a gradual decapitalization of  producers.  In a labor oligopsony, we would expect decrease in the welfare of labor, as the increase in the income of the oligopsonist has to come from somewhere. 
 
Efficiency has also declined because an oligopsony buys less than the competitive equilibrium production, at a lower price creating what is called deadweight loss:  The blue triangle in Diagram 5.  (I’m not sure if the blue triangle is exactly the right one, as I am not sure the exact location of the point of competitive equilibrium in the absence of oligopsony.) That is, the economy is producing less than it would otherwise, perhaps less than it needs to.  In a labor market, this would imply increased levels of unemployment.  For instance, since the public sector also supplies the private sector, as the private sector becomes increasingly organized as oligopsony, we would expect public sector income, supported by taxes on labor costs, to decrease.  We would also expect, due to dead weight loss, an increasing shortage of public goods.


Wednesday, February 1, 2012

Oligopoly and the Economy


This is a brief discussion of the effect of oligopolies on an economy. It is an example of the macroeconomic effects of microeconomic processes.   The derivation is based on the idea of the kinked demand curve, developed by Paul Sweezy in the 1950’s. 
Those not interested in the derivation may jump ahead to the discussion at the conclusion. 
Those interested may find the various derivations of kinked demand curve theory on You Tube helpful, and perhaps easier to follow than what I have presented here.  Here’s one:
http://www.youtube.com/watch?v=5BQPx8SL9F4.
You might also find  discussions on monopoly, a simpler case of extra-normal profit, helpful.  Here’s one:
http://www.youtube.com/watch?v=3NMbcfS68IQ&feature=related
And for contrast, perfect competition:

We discuss competitive oligopolies, where collusion is not necessary for fixed prices.
For your convenience a little background.  Oligopolies are a common market structure.  Indeed, many markets seem to evolve, or  have evolved, into oligopolies, (or its cousin, oligopsonies,)  They are ubiquitous.

An oligopoly has some of the characteristics of a monopoly, in that its members can charge higher than normal prices and make higher than normal profits.  The particular characteristics of an oligopoly are,  1 It consists of a relatively few, relatively large, sellers  2.  Each firm is big enough to affect the others. 3:  The products are similar or identical.  4:  There are barriers to entry, such as initial capital costs. 

The traditional analysis of oligopolies is that, rather than a normal straight demand curve, they face a kinked demand curve D, which for a particular firm is also their average revenue curve AR.  Diagram 1 shows this demand curve for a particular oligopolist.  The oligopolist wants to sell at the kink, which is at some price pa, which is really determined by the market, and some quantity qa, which is determined by other factors, which we will discuss in the conclusion.In any event, the kink is at a price higher than the equilibrium price in perfect competition, and a quantity lower than the equilibrium quantity. Fewer goods are produced, and consumers are forced to pay a higher price for them.

If we were to discuss all the members of this oligopoly, they would each have a separate, though similar, diagram.  The prices at the kink would all be the same, but the quantities at the kink might be different. 

  
Our oligopolist’s total revenue, that is, how much money he takes in, is price times quantity sold, or pa x qa.

Why does he want to sell at price pa?  If he raises his prices above pa, to pb hoping to make an extra profit, none of his competitors will follow.  So his prices will be above theirs, and because their products are similar to or identical to his, he will lose some, perhaps many of his customers to them.  If his price goes up a little, the quantity of products he sells will go way down, to qb so he will take in less money. The area  
pb x qb, the money he takes in now, is less than the area pa x qa, the money he took in before.  This is the characteristic of an elastic demand curve. As you move up the curve, the quantity sold goes down faster than the price goes up.   

Suppose instead he lowers his prices, below pa, to pc,  hoping to gain market share.  Then his competitors will quickly follow suit, since they don’t want to lose their market share to him.  So he won’t gain market share, he’ll just be selling at a lower price, and making less money.  He may sell a few more products, at qc just because his, and everybody’s, price is lower, but not enough to compensate for the decrease in price.    The area  pc x qc , the money he takes in now, is less than the area pa x qa, the money he took in before.  This is the characteristic of an inelastic demand curve.  As you go down the demand curve, the price goes down faster than the quantity sold goes up.

Now for a firm to maximize profits, its marginal costs, MC, must equal its marginal revenue MR.  This is always the case, but what does this mean?  Marginal cost is the increase in total cost accrued by the firm for the next unit it produces.  If the firm produces 4 units for $60 and 5 units for $90, then the marginal cost of the fifth unit is $30.

Marginal revenue is the increase in revenue that results from selling one more unit.    For imperfect competition, as we have in the case of oligopolies, MR is always less than the average revenue, AR.  This is because when you sell more units, you have to sell them at a lower price, but you have to sell all your units at that lower price.  So if you sell 4 units at $100 total revenue and 5 units at $120 total revenue the average revenue AR, the price you are selling them at, for 5 units is $24, but the marginal revenue MR for the 5th unit is only $20.

Profit is maximized when MR = MC because when MC is greater than MR, it costs more to produce the next unit than you get paid for it.  With the figures we used, you would produce 4 units for $60, sell them for $100, and make $40 profit.  If you were maximizing profit, you wouldn’t make 5 units for $90, having to sell them at $120, and only make $30 profit. 

See Diagram 2.  The marginal cost MC curve is the lopsided “u.” When you produce something, costs first go down, savings of scale, then they go up, dissavings of scale.  (Imagine a restaurant.  The first meal is very costly, because of all your fixed costs. As you produce more, each next meal is cheaper to produce, as you use your assets more efficiently, until you reach some minimum.  Then the costs per each additional meal start going back up, because you run out of stove space, people start getting in each others way, etc.) 

With the kinked demand or AR curve, the MR curve is very strange.  The upper ARU and the upper MRU curve, the curves above the kink,  both start at the same point on the axis, (in the direction where the arrows come together,) but the MRU curve descends more steeply, twice as steep, it turns out. When they reach the kink, however, the MRL and ARL curves, the curves below the kink, also extend from a point on the axis, (much higher on the axis) in the direction of the dotted arrows, so the MRL curve, being twice as steep as the ARL curve, is much lower than the MRU curve at the kink.  In this diagram, in fact, it is so much lower it is negative, which means MRL curve is irrelevant.  What is not irrelevant is the fact that, because MRL is negative, the MR curve which connects the MRU and MRL curves,  (green line) crosses the Q axis at the kink.  This means that the quantity of production of maximum revenue (which is where the MR curve crosses the Q axis) and profit maximization (where MR = MC)are at the same quantity, qa.

What is important is the green line, the MR curve at the kink.  Now since, when we maximize profit,  MR = MC, when ever MC crosses the green line, the profit maximizing quantity and price are going to stay the same.  See Diagram 3.  The firm, whether its marginal cost curve is MC1, or MC2 or MC3  is going to want to produce the same amount, and charge the same price.  Here this will maximize both profit and revenue.


Conclusion:
 Even in competition, oligopolists can make extra-normal profits.   Firms in oligopolistic competition tend to be locked in to price, so they must find other ways to compete, and maintain or gain market share.  (We make the casual observation that one need look no further than oligopoly pricing (and as we shall see, oligopsony pricing) to deduce a cause for Keynesian ‘price stickiness.’  In an economy rife with oligopoly we would expect many points of price, and quantity, fixedness, making deflation a uneven and problematic process.)  The owner of a service station, for instance, locked in competition with 3 other service stations at an intersection, might, to attract more customers, initiate full service, or add a convenience store or coffee shop.  He might do this, raising his costs, until the marginal cost curve was something like MC3 in Diagram 3.  The oligopolist would not want to raise costs any more, because then his profit maximization would occur at a price higher than pa, and he would lose market share.

However, the opposite can also happen.  Since price is, with in a range, independent of costs, the oligopolist may decide to shave costs, cut corners, and so increase his profit that way.  Were an industry to do this, we would have a situation like the American auto industry in the 60’s and 70’s, before imports began to significantly impact on their market.

Oligopolies do not consist of identical or identically sized firms, with identical shares of the market. The quantity a particular oligopolist sells at is determined by historical factors, and his ability, or inclination, to compete in ways which do not affect the price.  Historical factors, for instance, most notably their activities during the period their industry was more competitive and open, determined the relative sizes of GM, Ford, Chrysler, and American Motors, back when they constituted an oligopoly.  Foreign Competition and decisions since have changed their relative sizes and profitability.   

Another point is that, unlike perfect competition, firms of various efficiencies can co-exist in an oligopoly, operating at differing capacities and different economies of scale, each firm collecting its particular degree of profit.  And unlike perfect competition, much of this profit is extra-normal, more than the profits we would expect to see from perfect competition, which tends to drive profit to a minimum.

What other things might we expect?  Well, we would expect the transfer of some consumer surplus to the producer, in the form of his extra-normal profits.  Consider that oligopolies are becoming economically pervasive.  Each of these oligopolies extracts its rent, transferring resources from consumers, to the oligopolists.  Indeed, to simplify considerations, let us just model the entire economy as two tiers, consisting of an oligopoly and its market.  Consider first perfect competition, where the economy was efficient and in balance, Diagram 4.


Supply equals demand and the equilibrium point is at e, and surplus is divided between consumer and producer. (Consumer’s Surplus is  exaggerated a bit, to keep the lines the same.  Sorry.)  With oligopoly, Diagram 5, there is a net transfer of surplus from the consumer to the oligopolists. (the greenish-yellow box) 


 In the real economy, this would be manifest as higher corporate profits, and, since most corporate stock is held by the wealthy, an increase in income of the wealthy.  Corresponding to this, we would expect a decrease in the welfare of the rest of the economy, as the increase in income of the wealthy has to come from somewhere.

Efficiency has also declined because an oligopoly produces less than the competitive equilibrium production, at a higher price creating deadweight loss:  The blue triangle.  That is, the economy is producing less than it would otherwise, less than consumers would be willing to buy at the lower, equilibrium, price.  Indeed, the economy may perhaps be producing less than it needs to.  For instance, since the public sector is also supplied by the private sector, as the private sector becomes increasingly organized as oligopoly, we would expect public sector costs to increase disproportionately.  We would also expect, due to dead weight loss, an increasing shortage, and/or a decline of the quality, of public goods.  This includes much of the infrastructure the private sector, the oligopolist, relies on.

Wednesday, January 11, 2012

Link to Michael Hudson- Democracy and Debt

Nice read here:

http://michael-hudson.com/2011/12/democracy-and-debt/

All about the financial sector’s inability to restrain their economically destructive tendencies throughout history, and the social ruin attendant on their ascendancy.
We get to see it again. They get to see it again. And they still can’t restrain themselves.

Saturday, December 31, 2011

On the Economics of Evil

Elsewhere, http://www.truthabouttheone.com/2010.07.01_arch.html we have talked about how evil arises in the mind, and a little of how it is made manifest in the world.

One may wonder how one talks about evil in an economics blog. It is almost impolite. After all, evil is, in the end, irrational, and ignorance part of its nature. And economics is the domain of the all knowing, rational agent. One might say, economics is the study of the behavior of God, or gods, at least, anyway, under some of its more implicit assumptions. Perhaps this is one of the profession’s problems, then, when trying to explain the behavior of men.

Evil is as evil does. So what is as evil does? What is the economics of evil?

Evil sacrifices the greater good for its immediate gain. Since its own welfare is ultimately dependent upon the greater good, it thus consumes the foundation of its own wealth, and must look ever farther to feed its hungers, until it can no longer support itself, and collapses. But before it collapses, it may have consumed the substance of many. Those incapable, those inattentive, or those ineffectual in opposing it.

Eventually, good always triumphs. Good may triumph through might. But the reason, though, good always triumphs is because in the end, evil always fails. But it may succeed for a time, and the damage it may have inflicted be awful.

And when the good turns evil, it fails. Signs of turning evil are signs of failure. But not all signs of failure are signs of an internal evil. Failure may be imposed from above, inflicted.


It first seems as if we can talk about evil in terms of what are called discount rates. An individual with the lower discount rate is a person who ‘values the future more.’ He is a person more prepared to reduce consumption today so that he has more to consume tomorrow, and is held as somehow more virtuous, ‘more good,’ than someone who consumes more today, with perhaps less thought of tomorrow.

But we are living through a period where this virtue turns into exploitation, and destructive of the foundations of all wealth. An individual with a lower discount rate, exchanging with a person with a higher discount rate, will eventually come to possess all the other has, no matter how small the difference in discount rate. Even if the person with the larger discount rate is a person of relative virtue, he is not virtuous enough to retain his wealth. Is the gradual confiscation of the wealth of the less virtuous, then, itself a sign of virtue, or a sign of a lack of restraint, and of evil?

Or is instead the failure of the person with the higher discount rate a sign of his ‘evilness?’ For failure is what will result. He will lose his capital. Should he now be condemned to labor as a slave on behalf of the person with the lower discount rate, who now may consume the fruits of the labor of both, in perpetuity? Who is evil? The slave, who has become so because of his inadequate virtue, or the slaver?

The slaver, having consumed the wealth of his slave, is reduced to consuming the slave’s surplus, which it is in the slave’s interest to minimize. Having reduced the slave to subsistence, the slaver must then compel him to produce more.

So we see that commission of a lesser evil, what can be just a tiny difference in discount rates, by one, becomes, if not countered, the making of a greater evil, by the other.

Where is the happy median?

The accumulation of capital by a society is a great virtue. But so is its proper allocation. And this proper allocation is necessary, for when the wealth of a society becomes excessively concentrated, it can no longer maintain itself without the consumption of the capital of the rest of that society. Virtue pursued to excess has become Evil.

It justifies itself by its earlier successes still, yet its ends have changed. No longer is virtue seen as the pursuit of the common good. For the common man has proven himself to be without virtue, and dross, unworthy of the considerations of the powerful. What was Virtue turns to the fulfilling of its own now insatiable needs, and, at first just incidentally, the impoverishment of others. It goes too far, first blighting the lives and hopes of those less endowed, or less lucky, and then becoming corrupt and turning on itself, feeding on itself.


Evil is seldom pure. How do we recognize when virtue has turned evil, and harnessed to evil ends? How do we recognize the deterioration of our society, our nation, and our world? How do we recognize the infliction of evil, and the imposition of failure?

After all, Evil will cloak itself in virtue. Its agents may even, at first, imagine themselves virtuous. And what it imposes will not be called failure. It will be called something else. Evil deceives, doing one thing while saying it does another. And where it does what it says, its motives and goals are not what it says they are. But because Evil’s ends are irrational, as these become clear, irrational too become its justifications. Its speaking, and its actions, become increasingly detached from reality, and from each other. And its speaking and its actions become increasingly incoherent

Evil inflicts misery, whether or not it profits. And its profit is always less than the misery it inflicts. Evil provides no nourishment. What it seems to provide is never worth the price.

Evil does not create, except implements of destruction. It only manipulates, and takes. Indeed, creation is anathema to Evil, which opposes creation at every turn. It destroys what it cannot have, and pollutes, both what it does not possess, and what it does.
Evil cannot control its appetite. No amount of wealth is sufficient to its needs. And what to others are wants, mere desires, to Evil are needs, and needs that can never be satisfied.

Evil’s end is not what power can do, to the benefit of others, but power itself, and what it can do to gratify its needs. Evil considers itself to be justified in its extravagance.
_________________

We coddle the wealthy. We are told that they are the creators of jobs. Yet, there were more jobs when they were not so coddled. There was more wealth, and more creation of wealth, when the wealthy did not have so much. And now, we are told, we must give them even more. We, the people, must tighten our belts, and sacrifice of our own wealth, to feed the needs of the wealthy, the wealthy creditors who hold our debt, the debt of the people.

But ask the wealthy. Are they not virtuous? Do they not deserve the rents they extract from the people? Have the people, the debtors, through their inferior virtue, not embonded themselves to their creditors, the wealthy?

We will always have the wealthy. They will always extract their rents and fees from the people. But when are they too much? When are they more of a burden, than any benefits which the people might gain from them? Or are the rents and fees extracted from the people put to good use? Who, or what do they feed? If the wealthy would be the masters of the people, are they good to the people, or are they not? Are the extractions returned to the people, as the virtuous master would do? (But why should they be? Are not the people of inferior virtue to the wealthy, and undeserving?) Or are they not instead turned on self consumption, and the feeding of the worms of competing corruption which are now at the economic processes at the heart of the nation, and perhaps the world?

With the growth of the global economy, the reach of Evil is the ends of the earth, and, unless effectively opposed and contained, it will consume the sustenance of all else before it consumes itself.

But- perhaps we should look at the latest corruption in high places as- justice. Tolerating Evil, even perhaps, as some claim, inflicting it on others, Evil comes to us.

There are those who believe that, or say that, having achieved wealth and prominence, that this is evidence of moral superiority; that they are morally superior to those of us who have not. (Have we ourselves not said this? Have we not used our nation’s wealth and power to justify our- ‘Exceptionalism?’) Do the wealthy use this to justify their stewardship, or their extravagance? Is it become an instrument to do good, or wealth to conspicuously consume, resources denied to others, and wantonly destroyed. Do they nourish others, or deprive them of things they value, of the resources needed for the enjoyment of such liberty as they have?

The moral justification of those in high places can be rephrased: They rule for the benefit of the people, to shower them with the blessings of their making. Or, instead, they rule to inflict punishments on the people, who by their inferior virtue, come to deserve them.

The powerful cannot be merely indifferent. Then they are only self-serving, and there is no basis to their claims on wealth, and no reason for society to grant them.

Are the poor and undeserving supposed to accept these hardships, laid upon them by the demands of the wealthy, as justice served?

And what do we see, but the enforcement of this process, the reduction of debtor to slave, by our government. Are we surprised then, by reaction against the government, since it has become an instrument of compulsion, for the extraction of rent from the people, to the vast enrichment of a few. The protector of the people, having become enslaved by the wealthy, is despised by the people. Do the people, rather than seeking their government’s freedom, despair of their government, and turn on it, and seek its destruction?

Do those who tolerate evil deserve evil things to happen to them? Is it a form of justice that those who tolerate evil, though they do no evil themselves, should be punished? Is tolerating evil itself evil? Is being a bystander to a crime itself a crime? Is to allow evil to consent to evil?

Justification for government and regulation is seen by the behavior of the wealthy. Without a strong and free government, the wealthy cannot do other than they do, and that is to wreak great harm on the society that supports them, and their wealth. And we, the members of that society, may react one of two ways: We may accept the punishment, allow the destruction of our society and our wealth, and consider it just reward for our failures, or we may oppose the evil.

Finally, though man is limited in knowledge and rationality, the shape of the future is becoming increasingly clear. The earth is limited. The ends of the earth have been found, and been found to be not so very far. Consideration of and action to counter overpopulation, global warming, the depletion of resources and increasing toxicity of the environment, are all becoming more imperative. Will man pursue the course of evil, with evil consequences, or will he seek the course of rationality, and act accordingly?

Sunday, December 18, 2011

European Debt Crisis: Talk by Dr. Heiner Flassbeck

OK. TV Time again. Take 20 minutes to understand the cause of the European debt crisis. http://www.youtube.com/watch?v=TFKzAAd_1W8&feature=player_embedded

Back in the 1990’s , just before the initiation of the euro, the Germans tried to institute a full employment policy by holding down wages for an extended period of time. That failed. They did succeed in beggaring their neighbors, however.

Or you can get it, where I first got it, at: http://www.nakedcapitalism.com/2011/12/class-war-low-wages-and-beggar-thy-neighbor.html

Where I was pointed by: http://yanisvaroufakis.eu/2011/12/15/never-bailed-out-europes-ants-and-grasshoppers-revisited/ (Although I visit nakedcapitalism.com regularly.)

Dr. Flassbeck concludes with a few words about the US, worth noting also.

Still like the idea of Import Certificates, since they force the balance of trade, and each country's policy is independent of any other country's policy, even if with a currency union.
http://anamecon.blogspot.com/2011/10/import-certificates-problem-and.html

Wednesday, December 14, 2011

Debt, Total Debt and by Sector as Ratios to GDP


Well, I am stung by “reason’s” criticism of my ‘misleading’ graphs. Yes, they were in nominal terms, but nominal terms are what you have to repay. But here are the same data as graphs plotted as ratios to GDP. They are all ratios of the nominal figures, so the ‘nominality’ cancels out. Not as good as ratios to income, as reason further suggests, especially the likely to be interesting ratios to the income of the various sectors. Which we shall see.

In any case the picture is no prettier, although noisier, ratios being what they are. See: http://anamecon.blogspot.com/2011/10/today-were-just-going-on-little-about_09.html

for the original graphs.


Here is total debt to GDP:


This is the sum of these figures:

GFDEBTN/1000 Total debt of the US federal governemt, divided by 1000because the original graph is presented in millions, and for some reason just doesn’t convert if you naively add graphs together.
HSTCMDODNS Total Household debt of all kinds, I think.
SLGSDODNS Total debt of State and Local Governments.
TBSDODNS Total debt for non-financial businesses.
DODFS Total debt for financial sector.

Pretty much still exponential, with a bulge during the Reagan years. Reagan's good years financed by deficit spending? What would Keynes say?


Here is the graph for the various sectors, separated. Still clear, or even more clear, actually, is the point I was trying to make, in my comment, with the original graph, that deleveraging, and it is mostly deleveraging in the financial sector, seems to correlate with the federal government going into debt at an ever faster rate. That is, our government seems to be borrowing from the banks, to rescue the banks. And the debt that is still increasing, is the debt of the people.


One thing that is interesting is that the debt of the financial sector has gone from the lowest to the highest. Who do they owe? Check out: http://www.youtube.com/watch?v=1eSVIXQzsFs


Looks like the banks are just a front.

Saturday, December 10, 2011

Advertising is (Mostly) a Waste of Resources

Advertising is (Mostly) a Waste of Resources

In 2008, the year for which I have figures (Outsell July 14, 2008 Third Annual Outsell, Inc. Study Forecasts $412.4 Billion in 2008 Advertising and Marketing Spending, of which $250 Billion or so was directly for advertising) That works out to some $830 for every man, woman and child.

Advertising and Marketing work out to about 3% GDP. But what is produced?

Advertising and conservation of money: People can only spend so much. They can only spend as much as they earn. Less taxes, of course. Oh, sure, they can go into debt, and spend more now. But that means, in the not so long run, they end up spending less than they earn, since they cannot spend what they lose in interest and charges on the loans they take out. Or they can save and spend a little less than they earn now, and in the not so long run, have a little more to spend than they would otherwise, assuming they gain a little extra in interest. But that’s it. That’s the most people can spend, and it doesn’t matter how much is spent on advertising. So advertising is at best a zero sum game. Advertising cannot make people spend more. In fact, if it encourages people to go into debt, it causes people to have less to spend, in the not so long run.

So spending on advertising is at best competing for a fixed quantity of dollars. But in the real sense the more resources are spent on advertising, the fewer resources are available for production of useful goods, and services, and the poorer society is. The poorer the consumer is. And the poorer the producer is.

Advertising is an example of what’s called a failure of composition: One business, if it advertises, gains a benefit in increased sales. But if all businesses advertise, then they all lose, because the market can only be so large. In fact, the market is actually smaller due to the fact that the more advertising, the more society’s resources are diverted from productive activities to paying for that advertising. The less money is available to produce other, perhaps more desirable, goods and services for society, so the poorer society is. Unless you consider money spent on advertising as a net contribution to society, like, say, art. But what kind of art does it qualify as?

Now what is true in general is true specifically for the holidays: The holiday shopping season does not increase consumer spending. Advertisers spend more, and yes, consumers do spend more during the holidays. But, they simply have only so much to spend each year, so the existence of a holiday season makes no difference in the total that would be spent each year, and thus the total that is spent.

Consider Black Friday. Where one store opens early, it has an advantage. Where all stores open early, there is no advantage, but all stores incur additional expense.

This brings us to a clear case where regulation makes an economy more efficient, and that case involves what used to be the so called Blue Laws. These were laws which banned most retail stores from being open one day a week, usually Sunday. (Pharmacies were a notable exception, but even they could only sell medical related merchandise.) Now as we argue, annual personal expenditures are conserved. That is, having seven days a week or six days a week of shopping makes no difference to the amount of money available to be spent. No more is spent in seven days than would be spent in six. Or looking at it the other way, no less would be spent in six than is spent in seven. But with stores open seven days, what we have is the increased expense of keeping those stores open the extra day. Since retail trade represents about 7% GDP, a reduction of 1/7th of its (real) expenses would result in a 1% increase in the efficiency of the economy. About $130 billion, or about $430 would be made available for every man, woman and child in the economy. ( We say ‘real’ because we’re talking actual resource usage, electricity and wages, not nominal expenses like rent. Rent isn’t going to change, but paying rent isn’t consuming resources. It is merely a transfer of demand (for resources) from the retailer to the landlord. Also, the actual ‘real’ savings is probably going to be somewhat less, since heating, and cooling, of the store must be done seven days a week, to some extent, whether the store is open or not.)

This is another example of the failure of composition. Clearly, if just one store is open on Sunday, that store will have more business. It will take business from its competition. But with all the stores open on Sunday, we have seen that there can’t be more business for all the stores, and there is instead the added expense of the stores being open seven days instead of six. Having his store open seven days instead of six is, for a retailer, a very significant expense, an expense he passes on to his customers. His customers, paying more for each item, are not able to buy as much stuff, and so are less well off. Consumers pay, in real goods and services, real resources, for the convenience of shopping on Sunday.

Now something similar to the increase in efficiency which would be obtained by closing stores one day a week is being driven by increased retail selling over the Internet, which is reducing the number of brick and mortar stores, and thus the expense involved in operating them. On the other hand, Internet competition is forcing those stores which remain open to be as convenient as possible, thus inducing them to be open on Sunday.

Some advertising is desirable, bringing the buyer to the seller, and informing the buyer of his choices. But more than that is, from a social point of view, harmful, not because it influences buyers into making sub-optimal choices, (which it may,) but because it consumes resources to no one’s benefit.

The irony, of course, is that the billions of dollars per year spent on advertising have not lead to an increase in corporate profits, but rather an increase in expenses, and a decrease in profits. Though not in percentage of profit. Advertising simply does not increase the amount of money available for the consumer to spend, but its expense must be borne by all producers and consumers. The result is higher prices, and a reduction in the quantities produced and consumed. The more advertising, the greater the expense.

A technical note: The degree to which the producer or the consumer bears the cost of advertising depends on the relative elasticity of the supply and the demand, just as with taxes: Elasticity of demand is the ratio of the change in quantity demanded to the change of price. Elasticity of supply is the ratio of the change in quantity supplied to the change of price. A large elasticity implies a large change in quantity leads to a small change in price. A small elasticity implies a small change in quantity leads to a large change in price.

Now if demand is less elastic than supply, consumers bear the greater burden of the cost of advertising. If supply is less elastic than demand, producers bear the greater burden of the cost. From this, we would expect producers to spend more money on advertising relative necessities, such as food, than discretionary goods, such as automobiles, or jewelry.

But there is significant advertising in many discretionary goods, where the producer would seem to bear most of the costs.

Now in today’s global economy, where supply is often world wide, supply tends to be very elastic, and so for most goods, the burden of advertising is borne by the consumer. In the case of jewelry, and articles geared for the wealthy, for whom price would seem to be no object, it would appear that demand is relatively inelastic. Thus a disproportionate amount of money would be spent on the advertising of luxury goods. On the other hand, there does not seem to be so much advertising for interchangeable necessities, such as different brands of gasoline.